Are you new to the stock market and wondering what is ‘Gann Theory’?
Don’t worry! I am here to help you out. Today, I am going to discuss a more than a century-old trading strategy. This strategy involves the use of Gann Theory and I am going to tell you all about it from A through Z.
What is Gann Theory?
Gann theory was a concept developed by William D. Gann in the 1900s. He was a successful trader of his time and believed that the change in the stock price has an angle to it. In other words, an asset moves in angles. He observed that the change in price was related to the natural geometric shapes prevailing and predicted the future movement of price with relation to time for any stock. This is why the Gann theory is also known as the ‘Gann Angle theory’.
Gann trading strategy is still in use and if correctly applied, can predict an asset’s movement up to at least 90% accuracy. W. D. Gann was of the opinion that there exists a time cycle in nature that applies to the market as well. The discovery of his theory was based on natural geometric shapes, astrology, astronomy, and ancient mathematics.
According to Gann theory, the angles and patterns formed by an asset in the market can be used to predict the future movement of the price.
Who was William Delbert Gann?
William Delbert Gann or W. D. Gann or William D. Gann was a finance trader and astrologer who developed various technical analysis tools such as the Gann angles. He was also fond of sharing his knowledge in the form of writing and hence authored numerous books and courses on trading. He is known to author the first-ever book to be written on the share market named “The Truth of Stock Tape”. He made over $50 million before he died in 1950 and ruled Wall Street for over 50 years. He had a trading accuracy of over 92%.
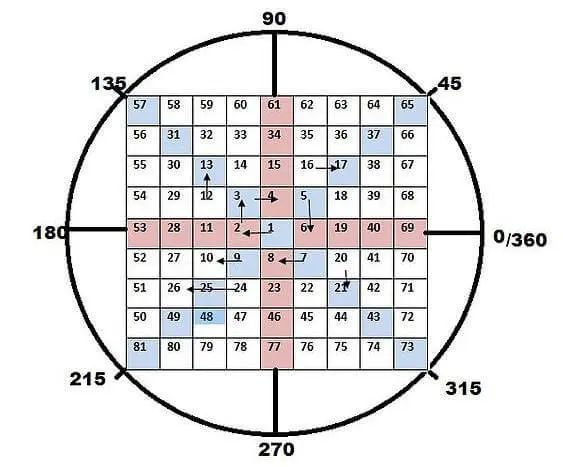
Moreover, he invented the spiral chart often known as the ‘Square of Nine’ chart.
What is the ‘Spiral Chart’ or ‘Square of Nine’ chart?
This chart is used to apply the Gann trading strategy or Gann theory. It is a nine by nine matrix of numbers from 1 to 81 arranged in a counter-clockwise spiral. The number 1 is placed in the center and the numbers after it are placed in a spiral out from it. The picture below will give you a clear view.
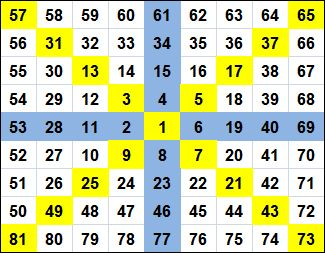
Here you can observe that the numbers are moving in an anti-clockwise spiral in an increasing order starting from 1 in the center. Once a spiral/cycle/bracket gets completed, it moves on to the next one. For example, 2-3-4-5-6-7-8-9 are in one bracket after which the number 10 gets placed in the next bracket.
This Gann indicator has cardinal and ordinal numbers. Cardinal numbers are the ones in Blue and ordinal numbers are the ones in Yellow. You’ll also notice that the ordinal numbers are square numbers. W. D. Gann explained that any number that falls on any of these numbers works as strong support or resistance depending on the stock.
An interesting fact about the numbers present in the Gann square is that they follow a certain harmonic pattern. For example, the number 52 has the number 27 next to it. This can be calculated as follows
- Square root of 52 = 7.2
- 2 – 2 = 5.2
- Square of 5.2 = 27
Where 27 is the number next to 52! This applies to all numbers in the Gann indicator.
Recommended: Peter Lynch’s Formulas for Valuing a Stock’s Growth
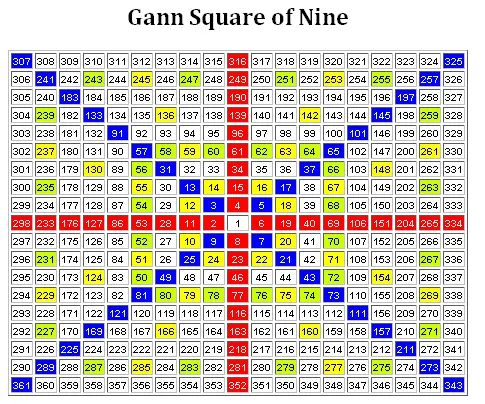
Why the number 9?
D. Gann believed that the number ‘9’ was unique and had something special. He believed that 9 is a crucial number and is used to measure all things. The number is the largest and last single-digit number. It is also evident that if you multiply any number by 9, and then add up the digits the sum would be 9.
For example, 4 x 9 = 36 ⇒ 3 + 6 = 9
6 x 9 = 54 ⇒ 5 + 4 = 9
What are Gann Angles?
Every price movement has an angle to it which can be explained by the Gann square.
Key important angle numbers are as follows:
- 0°/ 360° : 2, 11, 28, 53 ⇒ 4n2-3n+1
- 45° : 3, 13, 31, 57 ⇒ 4n2-2n+1
- 90° : 4, 15, 34, 61 ⇒ 4n2-n+1
- 135° : 5, 17, 37, 65 ⇒ 4n2+1
- 180° : 6, 19, 40, 69 ⇒ 4n2+n+1
Note: These angles are counted counterclockwise
How is the Gann Indicator used?
Gann indicators are easy to use and can be an easy trading strategy. It is somewhat similar to the Fibonacci levels. If you don’t know about the Fibonacci series don’t worry.
A Gann angle is a line (a diagonal, generally) that moves at a uniform rate. It might be sometimes confused with a trendline, but trendlines do not move at a uniform rate. Higher bottoms indicate an uptrend and lower tops indicate a downtrend. Uptrends are made after connecting bottoms and downtrends are made after connecting tops of the price. With the help of the Gann angle, a trader can set targets and trade accordingly. Gann trading strategy can be used to predict support and resistance levels of an asset with the help of Gann angles.
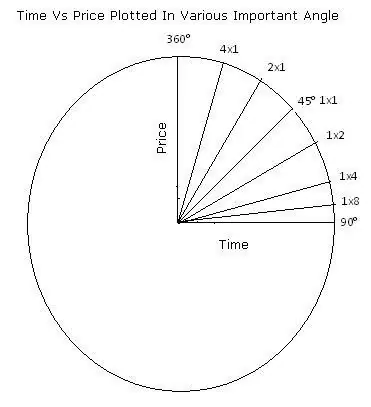
When a certain Gann angle is reached (or angle level is broken), it tries to reach the next angle. These angles are marked generally as 1X2, 1X1, and 2X1. Here, 1X2 means that with every one unit movement of price movement with two units of time, this defines the slope of the angle. 2X1 represents an angle in which there is one unit movement in time with two unit movements of price. 2X1 shows a weak trend, whereas 1X2 shows a strong trend. In other words, the steeper the angle the stronger the trend and flatter the slope of the angle, the weaker the trend is.
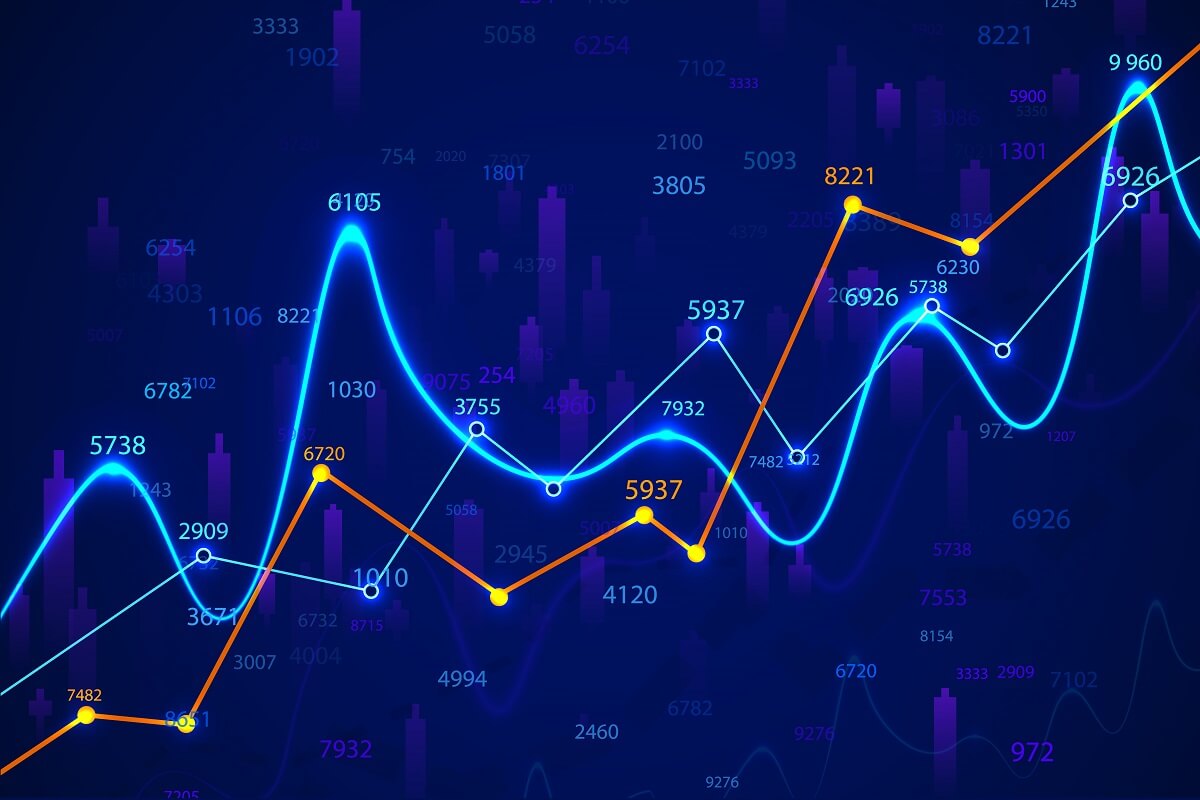
There could be various angles made using this concept such as 1X8, 1X4, etc. The following image will give you clarity.
1X1 is known as the 45° angle.
How to apply Gann Trading Strategy?
Gann developed this trading strategy based on the assumptions that
- The stock market moves in a time cycle
- The market is geometric in design and movement
- Price, time and range are the only factors that affect a market
A trader should keep in mind that the market moves in angles and these angles remain that same. These angles only get rotated. An asset moves from angle to angle and this is the ‘Rule of All Angles’. This rule states that once an angle is achieved it moves to the next angle. Gann angles are most commonly used to find support and resistance lines.
When support gets broken it is known as breakdown and indicates that the price will move down. On the other hand, when resistance gets broken it is known as breakout and represents that the price will go up.
Once a trader sets his time frame for making a trade he/she draws the Gann angles over the stock chart. These angles could be 1X1, 2X1, 3X1, 1X2, 1X3, etc. according to the need and then the trader reads the movement of price based on these lines.
Note: Uptrending angles describe support and downtrend angles indicate resistance.
Sometimes a combination of angles and horizontal lines is used to define the support or resistance. For example, if a stock is in a bullish mode then it might retrace up to 50% this level will set as the support level for the stock, whereas, if a stock is in bearish mode the 50% retracement level will mark an important resistance level for the stock. When the price has been moving between angles, these angles mark as strong support and resistance levels for the asset. These areas are also known as price clusters.
It is important to note the strength of the trend in the market. If a trader trades in a weak trend the risk increases and thus might result in losses. A trader must always enter a trade with a stop loss. The stop-loss price is set at the level of price opposite to what the trader expected the price to move in. For example, if a trader thinks bullish of a stock to trade, they should set the stop loss at a price lower than the current market price or last traded price (CMP or LTP).
Also Read: The Inspiring Success Story of D-Mart’s Radhakishan Damani
Gann trading strategy can also be used to determine the time zones for certain price levels. This includes predicting when certain price levels will be reached, when there could be a reversal, etc. Gann angle indicators work better on long-term charts as the levels can be more clearly seen then.
Gann theory is a valuable technical analysis tool used by traders. The special nine square numbers help in setting targets and stop loss for any trades on the basis of the last traded price (LTP). Various websites can calculate these targets for you, including your stop loss for the trades. These targets calculated could be bullish and (or) bearish, a trader has to decide which targets he or she should go for.
Gann trading strategy using Gann indicators can provide one with numerous successful trades if used properly. Profitable trades from Gann theory require precision in its application, which only comes with time and experience. This theory can help you analyze the market better so that you are able to predict the future stock price movement. Remember, it is important to enter every trade with a stop loss and backtest your strategy always.
I hope you liked that article and learned about the intriguing concept of Gann theory.
Thank you and happy trading!